How real-time dashboards build investor trust
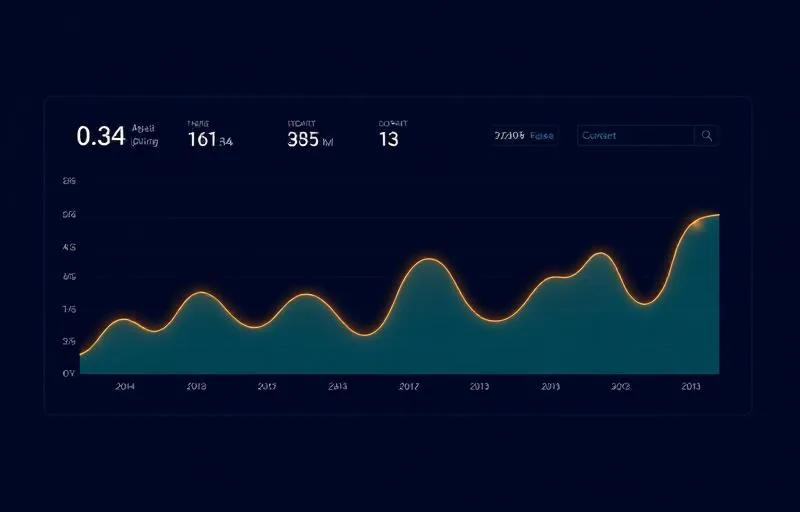
Investors don't just fund numbers; they fund the founders behind them. A live dashboard signals that you know your business cold, and removes the awkward 'let me get back to you' moments in board meetings.
Investors fund trust, not just numbers
When you talk to investors, most questions aren't about your product but about whether you have a grip on your business. Numbers are the proof, not the goal. A live dashboard shows in the most direct way that you know your business inside out: the figures are there, up to date, and you can answer any question on the spot.
The difference in a board meeting
Everyone knows the awkward moment: a board member asks about last month's burn, and you have to say you'll get back to them. With a live dashboard that moment disappears. You open the screen and the answer is there. That shifts the dynamic from you justifying numbers to a conversation about strategy.
Which numbers investors actually want to see
Not all numbers are equally interesting. Investors mainly look at the metrics that say something about health and growth:
- MRR or ARR: your recurring revenue and how it's developing.
- Gross margin: what's left after direct costs.
- Runway: how long you can keep going at your current burn.
- CAC payback: how quickly a customer pays for itself.
Once those figures are available in real time and reliably, your update no longer has to be a data dump.
From monthly data dump to strategy conversation
When investors can see the metrics that matter themselves, your monthly update shifts from 'here are the numbers' to 'this is what they mean and this is what we'll do'. You discuss choices instead of reading out figures. That's exactly the conversation investors get value from, and it sharpens you as a founder.
How we set it up
We set your dashboard up properly once, connected to your bookkeeping, so it stays current automatically. We keep the underlying books clean and updated daily, so the figures in your dashboard are always right. Between meetings you don't have to do anything: the numbers speak for themselves.
What a usable dashboard contains
A dashboard does not get better with more charts. What an investor wants is a small set that is identical every period, so the comparison over time holds. In practice that comes down to your cash position and its movement, your net burn, your runway, revenue with MRR or ARR and churn for subscription models, gross margin, and the few KPIs specific to your model.
That last part is the only place where customisation pays. For a marketplace it differs from a SaaS business or a hardware startup, and you make that choice once and then keep it.
What a dashboard does not solve
A dashboard is a window, not a solution. If the administration underneath is two months behind, the result is a chart that looks professional and is wrong. That is worse than no dashboard, because you make decisions on it and because an investor asks questions about it you cannot answer.
So the order is always the same: get the source right, then the display. A dashboard on top of messy bookkeeping is an expensive way to hide a problem.
From dashboard to investor update
The dashboard is the base, the update is the story around it. A monthly update that comes out of the dashboard is short and factual: these are the figures, this changed, this is what we are doing about it. Because the numbers are already visible, the conversation is about choices rather than reading out numbers.
Around a round or a board meeting that works in your favour. You have nothing to reconstruct, and the figures in your update tie to what your investors can already see. Differences between those two are the fastest way to lose trust.
Who gets to see what
Not every stakeholder needs the same access. A lead investor usually sees more than a small shareholder, and a board member needs a different view again from someone who only follows the quarterly report. Role-based access solves that without producing a separate export per recipient.
In short
- Investors fund the founder, and a live dashboard shows you have a grip.
- It removes the 'let me get back to you' moments in board meetings.
- Show the metrics that matter: MRR, margin, runway, CAC payback.
- Real-time figures shift your update from data dump to strategy conversation.
Part of our guide: Bookkeeping for startups: the complete guide
Curious what real-time bookkeeping looks like for your startup?
See how it works